Reversing the GoDaddy-ification of application monitoring
Scout is an "oops" company. We didn't build our product with the intention of turning it into a company, but we certainly can't imagine life without it today.
Scout was started out of frustration. The prospect of setting up and using a Nagios-like server monitoring solution was so terrifying, we'd rather build our own. We built a simple monitoring agent and an accompanying Rails-backed web interface and used it monitor our own apps. When debugging performance issues, we started sharing access to the app with our hosting provider, Rails Machine. They loved it and started using it.
We really enjoyed building the product, put a price tag on it, and over a bit of time, it became our full-time thing.
That frustration is back: app monitoring
Application performance monitoring (APM) products have a tendency to evolve into a GoDaddy-like experience.
The tools for monitoring apps are continually becoming more complex and difficult to use. It's the second law of thermodynamics applied to software. There's an ever increasing tendency toward disorder.
It's time to reset application monitoring.
From our own frustrations and those our customers have shared with us, it's clear app monitoring needs a craft brew-alternative: a polished, focused take on application monitoring. A product focused on solving performance issues as fast as possible and not overwhelming you with clutter.
We're building the craft brew of app monitoring
A bit ago, we decided to build an app monitoring product. We've got an awesome team dedicated to it and it's coming along fast. There's some core beliefs we're staring with:
- Support multiple languages and frameworks. We know from experience that we're mixing together more languages and frameworks than ever before. It's key to view their performance from a single interface.
- Easy time range diffs. The UI must be built to make it easy to compare deploys, config changes, or general trends as an application ages.
- Context. How is performance for our highest-paying customers? Is a performance issue impacting everyone or a subset of customers? Is slowness primarily associated with one database node? Make it easy to apply the context that matters to you.
- Aggregrate what's slow. We learn a lot from investigating slow requests. Rather than paging through metrics on individual slow requests, aggregate the call stacks of slow requests together. Apply the context from above. Know with certainty that an endpoint is slow because of a specific query for X% of your customers.
Sign up for our BETA
Get yourself on our early access list. We'll be inviting folks into APM ahead of our October launch. It's a great time to help shape the direction of Scout APM.
More to come
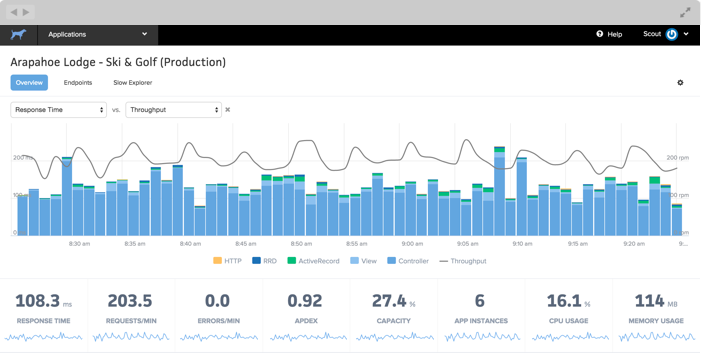
We'll be blogging about the product dev process right here, starting with the design decisions behind our application health dashboard:
Follow us on Twitter for the highlights and signup for early access.


